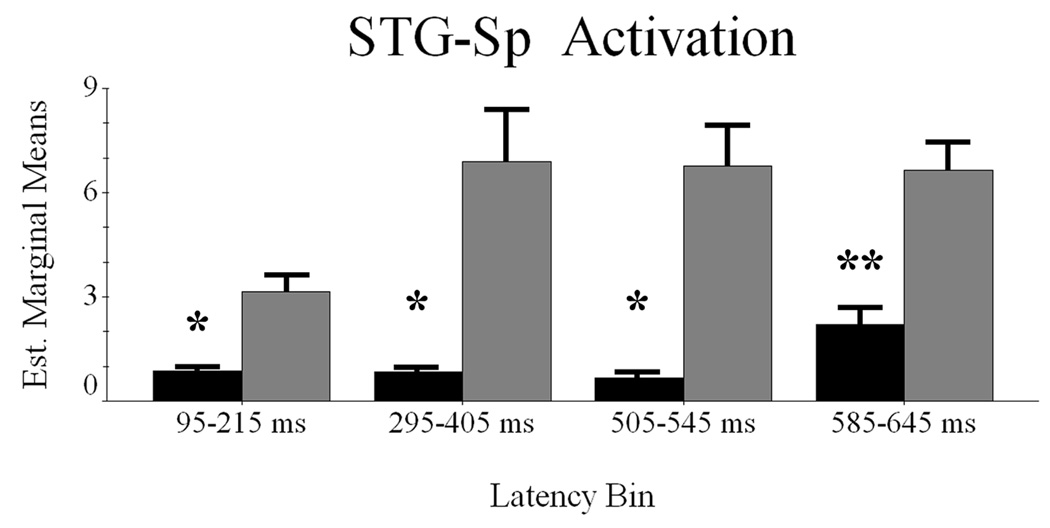
Figure 4.
Latency periods of maximal contrast between word classes in the STG-Sp region. Words are shown in black and pseudowords in gray; the abscissa and ordinate are also the same as in Figure 2–Figure 3. Error bars depict one standard error of the mean. Significant differences between the conditions within each time bin are denoted with asterisk(s). * = p < 0.05; ** = p < 0.01

