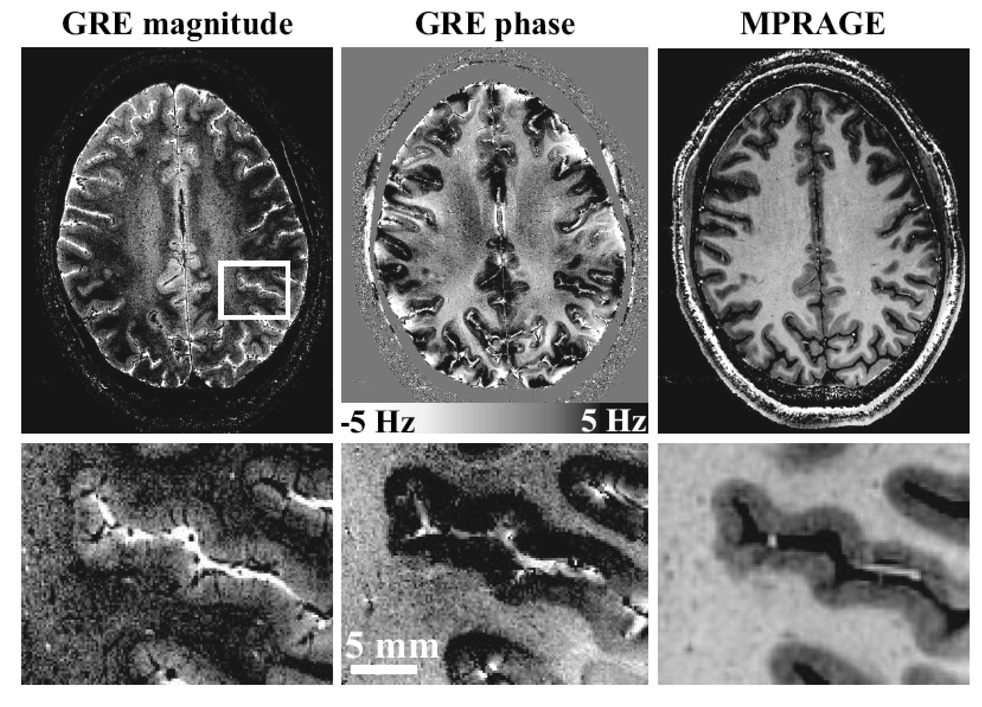
Figure 6.
Obtained from (Duyn et al., 2007). This is an illustration of the image quality of magnitude and phase images obtained at 7T. The GRE data, left and center, had a resolution of 240 × 240 um with a scan duration of 6.5 min, whereas the MP-RAGE data on the right had a resolution of 480 × 480 um and a scan time of 20 min. The scale bar shows the frequency shifts corresponding to the phase changes.

