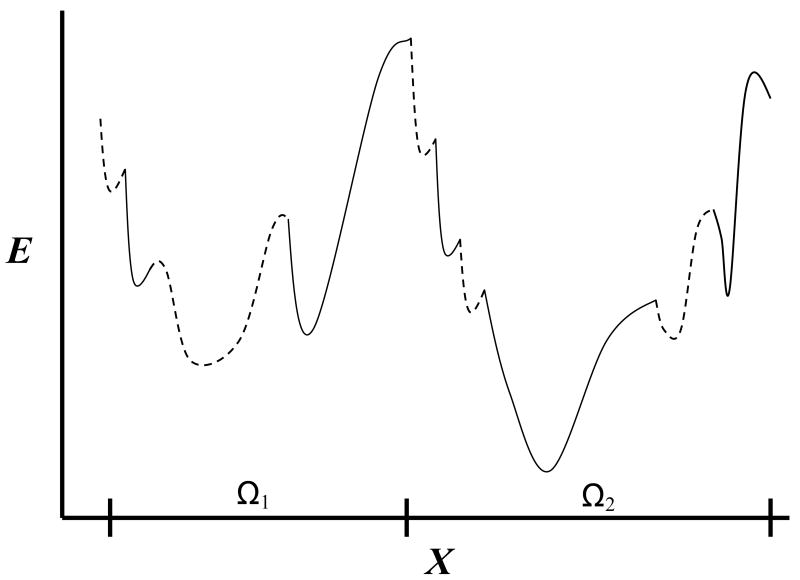
Figure (1).
Schematic one-dimensional representation of part of the energy surface of a peptide or a protein, as a function of a coordinate X. The two large potential energy wells are defined over the corresponding microstates denoted Ω1 and Ω2. Each microstate consists of many localized potential wells denoted intermittently by solid and dashed lines. The partition function Zm of microstate m is obtained by integrating exp[-E/kBT] over Ωm where Fm = - kBT lnZm is the microstate's free energy. The figure suggests that the second microstate is the more stable among the two due to lower energy and higher entropy (Ω2 is larger than Ω1) hence lower free energy. If F2 is also the global free energy minimum of a protein, Ω2 is expected to describe the native microstate (assuming a perfect force field) and a simulation started from Ω2 will keep the protein in this microstate for a long time. On the other hand, a peptide can populate significantly several of the most stable microstates in thermodynamic equilibrium.

