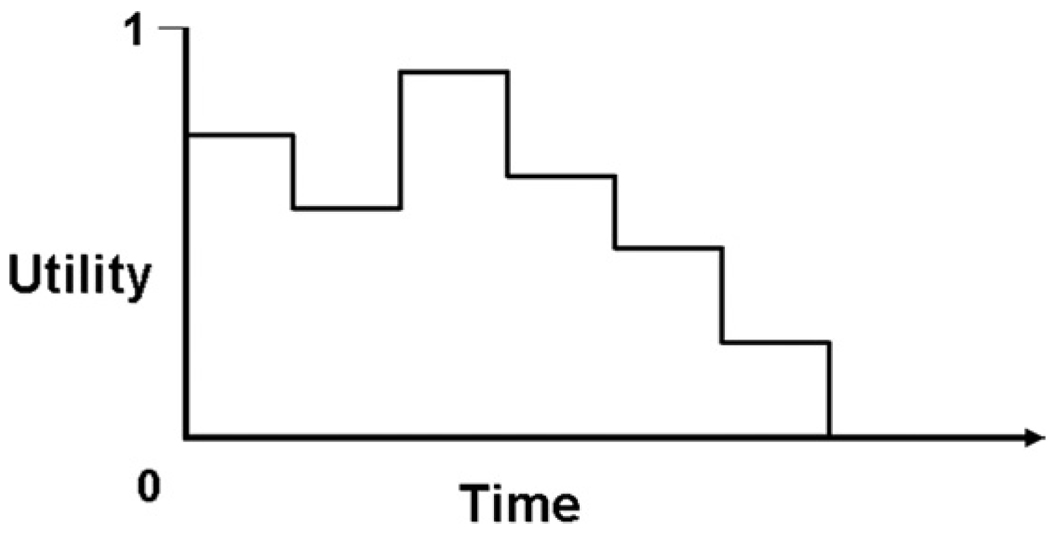
Figure 2. Quality-Adjusted Life Expectancy.
To calculate quality-adjusted life expectancy, the time spent in a particular health state (typically measured in years) is multiplied by the utility weight (possible range of 0 to 1) for that health state, and these products are then summed over time. Quality-adjusted life expectancy is thus represented by the area under the hypothetical “curve” in this figure.

