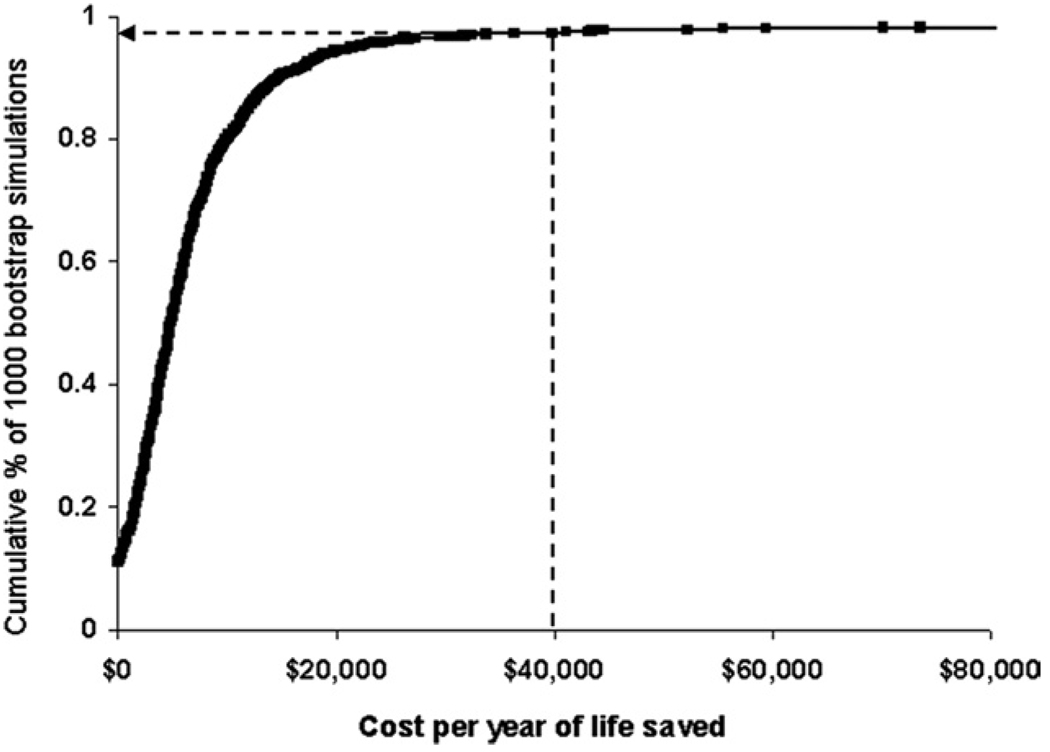
Figure 5. CE Acceptability Curve.
In this example, the likelihood that use of an embolic protection device during percutaneous coronary intervention of a vein graft (vs. no distal protection) is cost-effective is shown graphically across a range of theoretical cost-effectiveness (CE) thresholds. For each CE threshold (increasing from left to right) on the x-axis, the proportion of bootstrap iterations having a CE ratio at or below that threshold is plotted on the y-axis. As indicated by the arrow, 97.3% of the bootstrapped CE ratios were <$40,000 per year of life gained. Reprinted, with permission, from Cohen et al. (39).

