
Figure 1. Bacteriophage φ29 Packages DNA in Bursts of 10 bp.
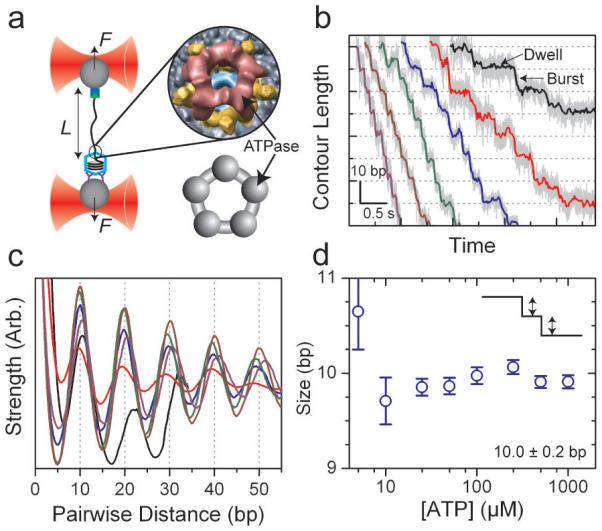
(a) A single packaging bacteriophage prohead-motor complex and its dsDNA substrate are tethered between two beads each held in an optical trap. Inset: cryo-EM reconstruction of the full motor complex26 (Courtesy of M. Morais), ATPase in red, pRNA in yellow, connector in cyan, and capsid in gray with a top view cartoon of the ATPase ring alone (below, gray). (b) Representative packaging traces collected under low external load, ∼8 pN, and different [ATP]: 250 μM, 100 μM, 50 μM, 25 μM, 10 μM, and 5 μM in purple, brown, green, blue, red, and black, respectively, all boxcar-filtered and decimated to 50 Hz. Data at 1.25 kHz are plotted in light gray. (c) Average pairwise distributions of packaging traces selected for low noise levels (50% of all packaging data; see Supplementary Figures 2 and 3). Color scheme as in (b). (d) The average size of the packaging burst versus [ATP] determined from the periodicity in (c). Error bars are the error in the slope from a linear fit to the peak position. Data collected at 500 μM and 1 mM [ATP] are not shown in (b) and (c) for clarity.