
Figure 2. Dwells Before 10-bp Bursts Contain Multiple Kinetic Events.
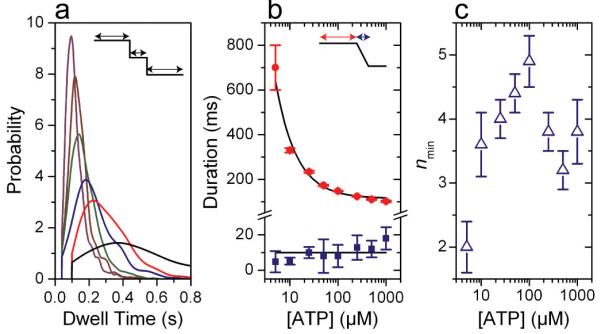
(a) Probability distributions for the dwell times preceding a 10-bp burst under low external load, ∼8 pN, and different [ATP]: color scheme as in Figure 1. Distributions were estimated using kernel density estimation with a Gaussian kernel and the optimum bandwidth46 and are truncated at the lowest detectable dwell time. Supplementary Figure 2 contains the number of observed bursts for each [ATP]. Distributions for 500 μM and 1 mM [ATP] are not shown for clarity. (b) The mean dwell time before the 10-bp bursts (red circles) for all [ATP] with an inverse hyperbolic fit (black) and the mean duration of all bursts (blue squares, average denoted by black line). (c) The minimum number of rate-limiting kinetic events during the dwell before the 10-bp bursts, nmin, for all [ATP]. Error bars are the standard error.