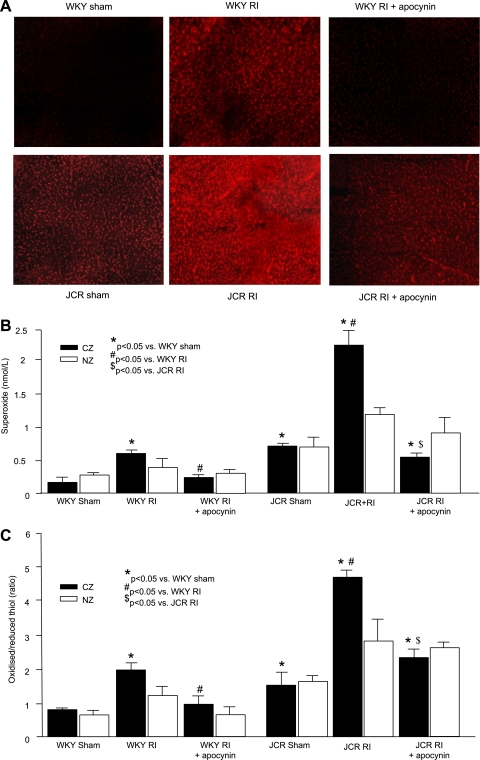
Fig. 2.
A: dihydroethidium fluorescence in the LAD-dependent zone on day 3 of RI after two periods of ischemia (40 s)-reperfusion (20 min) in WKY/JCR rats in the sham group, WKY/JCR rats in the RI group, and WKY/JCR rats in the RI + Apo group. B: O2−· levels measured by X-band electron paramagnetic resonance (EPR) in the CZ and NZ. C: oxidized-to-reduced thiol ratios measured by X-band EPR in the CZ and NZ. *P < 0.05 vs. WKY rats in the sham group; #P < 0.05 vs. WKY rats in the RI group; $P < 0.05 vs. JCR rats in the RI group.

