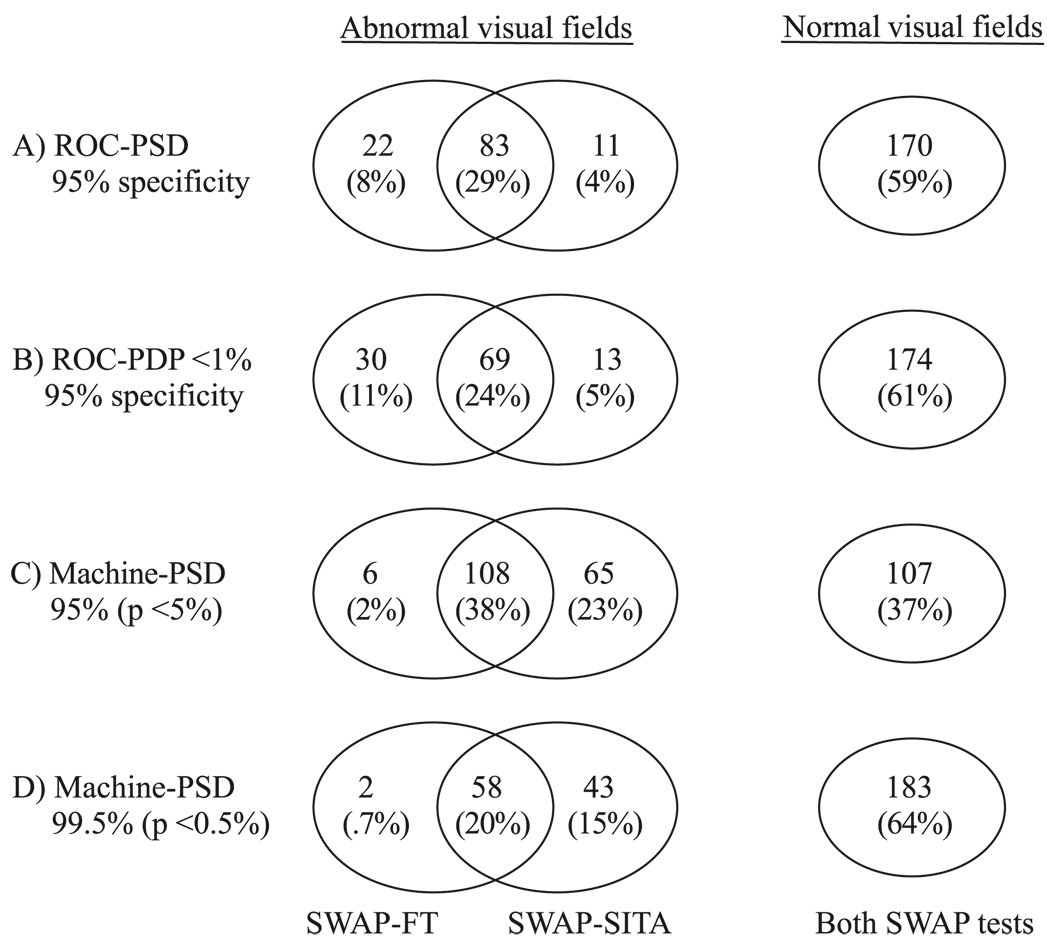
FIGURE 4.
Venn diagrams of SWAP using the FT strategy and the SITA outcomes among the patients with GON (n = 286). Visual field abnormality is determined by: (A) ROC curve-derived PSD at 95% specificity, (B) ROC-derived PDP points triggered at <1% at 95% specificity, (C) machine-derived PSD at 95% (P < 5%), and (D) machine-derived PSD at 99.5% (P < 0.5%).

