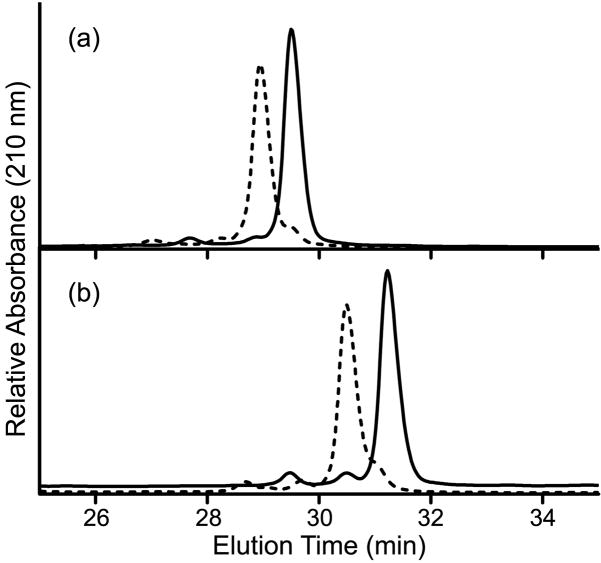
Fig. 2. Representative reverse-phase HPLC profiles of unphosphorylated and phosphorylated PhoB.
Untreated (solid line) and phosphoramidate-treated (dashed line) wild-type PhoB (a) and PhoBD101R/R115D (b) were analyzed on a reverse-phase HPLC column as described in Materials and Methods. The steady-state phosphorylation levels attained for wild-type PhoB, PhoBD101R/R115D, PhoBR115D and PhoBF20D are listed in Table 1.

