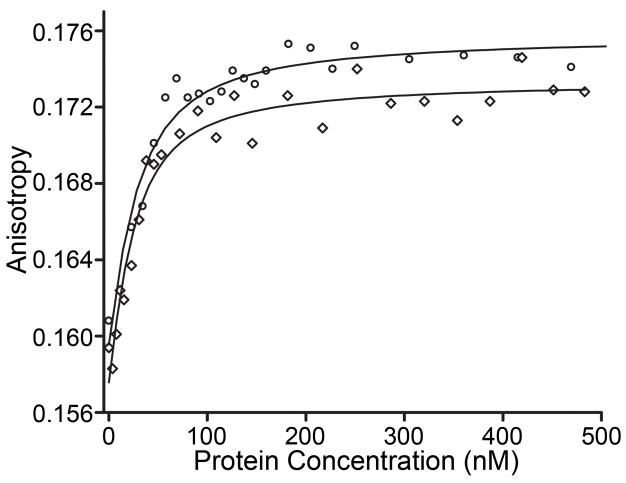
Fig. 6. Representative fluorescence anisotropy DNA-binding curves.
Binding isotherms for the phosphorylated forms of wild-type PhoB (circles) and PhoBF20D (diamonds) are shown to illustrate typical fluorescence anisotropy binding curves. A synthetic oligonucleotide (Fig. S1) that contains a portion of the phoB promoter was used in these experiments. Dissociation constants for all the proteins analyzed are listed in Table 3.

