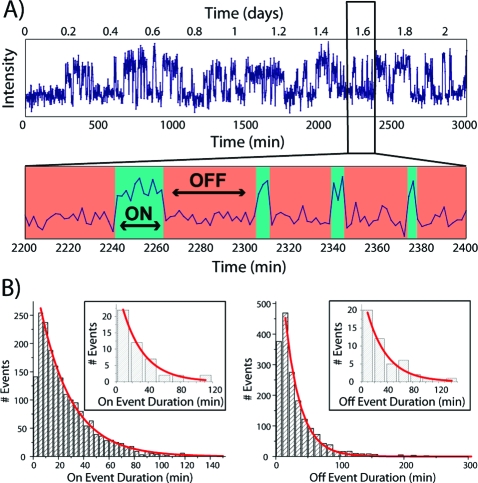
Figure 2.
Event analysis. (A) Fluorescence intensity trajectory of the particle depicted in Figure 1B. On and off events are denoted by green and red, respectively. (B) Histograms of all on and off events detected in the trajectories of a large number (N = 103) of single-aptamer traces. Insets show event distributions from the single trajectory shown in Figure 2A.

