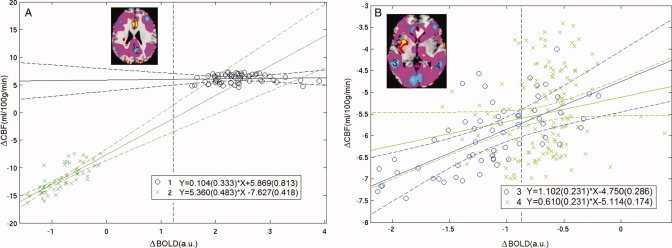
Figure 2.

Regional CBF‐BOLD coupling was assessed in four brain regions: (A) AC (blue “o”) and posterior cingulate (green “x”); (B) Right IPL (blue “o”) and left IPL (green “x”). A composite map of rCBF changes represents changes in rCBF averaged voxel‐wise across subjects in the transformed common brain template space. These ROIs were defined on the composite map of rCBF changes induced by sevoflurane; Bonferroni correction was applied for multiple voxel comparisons (P < 0.05). Within an ROI, each voxel is associated with the changes both in rCBF and in BOLD stimulated by sevoflurane, i.e., ΔCBF and ΔBOLD. Scatter plots are presented for each of the four ROIs. The data is displayed as a collection of points, each representing the coordinated ΔCBF and ΔBOLD induced by the agent for one voxel of an ROI (abscissa ΔBOLD and ordinate ΔCBF). The LR line, regression equation and 95% confidence bounds are given for each ROI.
