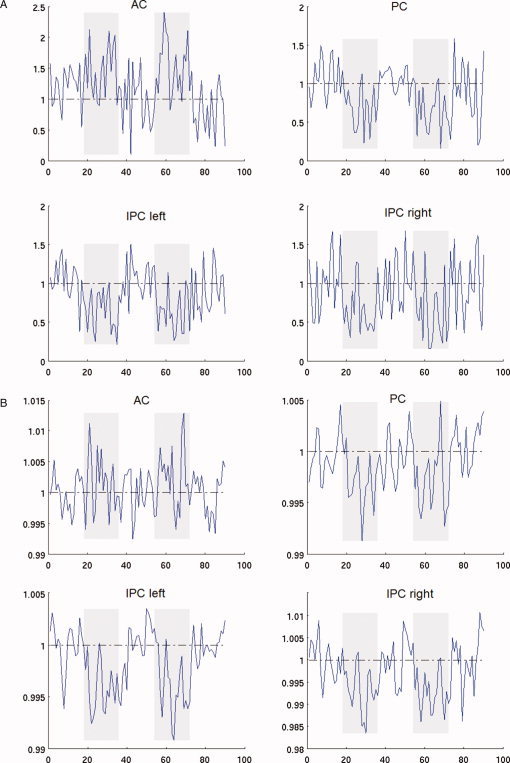
Figure 3.

Display of (A) rCBF and (B) BOLD time courses of AC, posterior cingulate and bilateral IPL from one representative participant. Only data based on the last 36 ASL images (18 pairs) of each anesthesia or no‐anesthesia session were shown to demonstrate differences between the two steady‐states. The rCBF or BOLD time course of an ROI was normalized by dividing by the baseline rCBF or BOLD value, which was the value averaged in time for all no‐anesthesia sessions. Potential intersession (anesthesia or no‐anesthesia) effect was adjusted (see Data Processing for details). [Color figure can be viewed in the online issue, which is available at www.interscience.wiley.com.]
