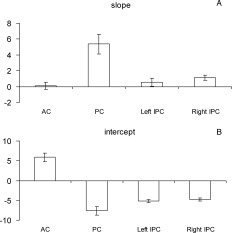
Figure 4.

Comparisons of the parameters of the LR lines seen in Figure 2—(A) slopes and (B) intercepts—with 95% confidence intervals. The LR lines show appreciable variability across the ROIs inspected. Significant changes in slopes or intercepts of the LR lines between ROIs were observed, showing the spatial nonuniformity of the rCBF‐BOLD coupling relationship.
