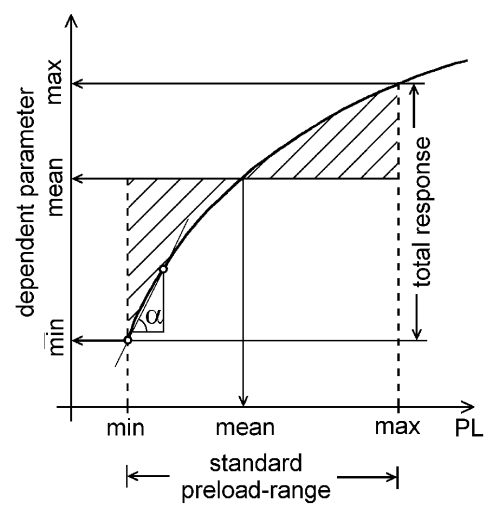
Figure 1).
General scheme for a function curve and its derived parameters. Preload (PL) was variable and afterload was kept constant. The contralateral ventricle was under standard loading conditions. For the ipsilateral-dependent parameter (flow, pressure) the minimum (min), mean and maximum (max) values were determined over the standard PL range. Total response was the range of response of the dependent parameter over the standard PL range. Initial slope was measured by tan α. Mean PL was determined from the mean value found for the dependent parameter

