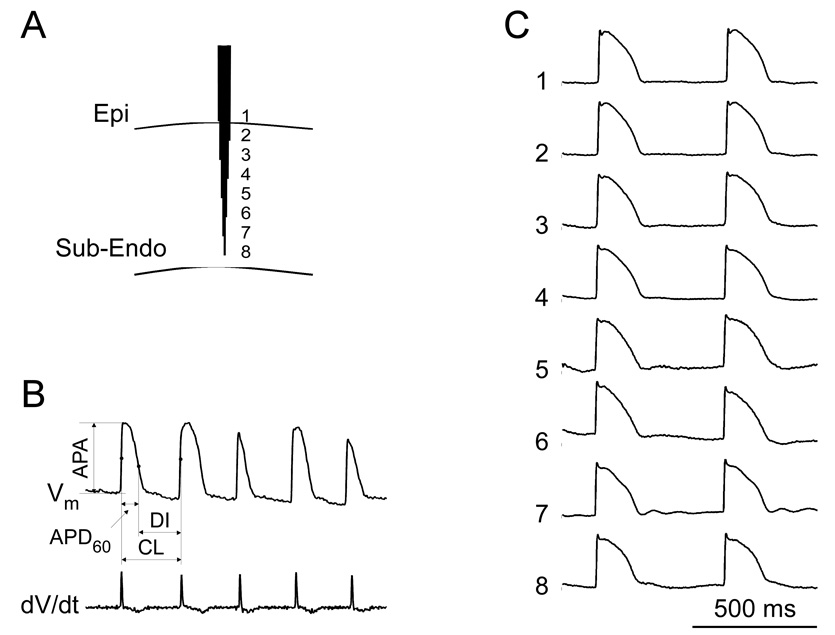
Figure 1.
A: Schematic diagram of optrode insertion in the anterior LV wall. Fibers are packed into hexagonal bundle with fiber ends separated by 1.5 mm. B: Parameters of AP measurements. The top trace is a Vm recording during VF; the bottom trace is its derivative. C: Transmural recordings during pacing at a CL of 500 ms. The mean APD60 at the 8 recording sites was 136±6 ms.

