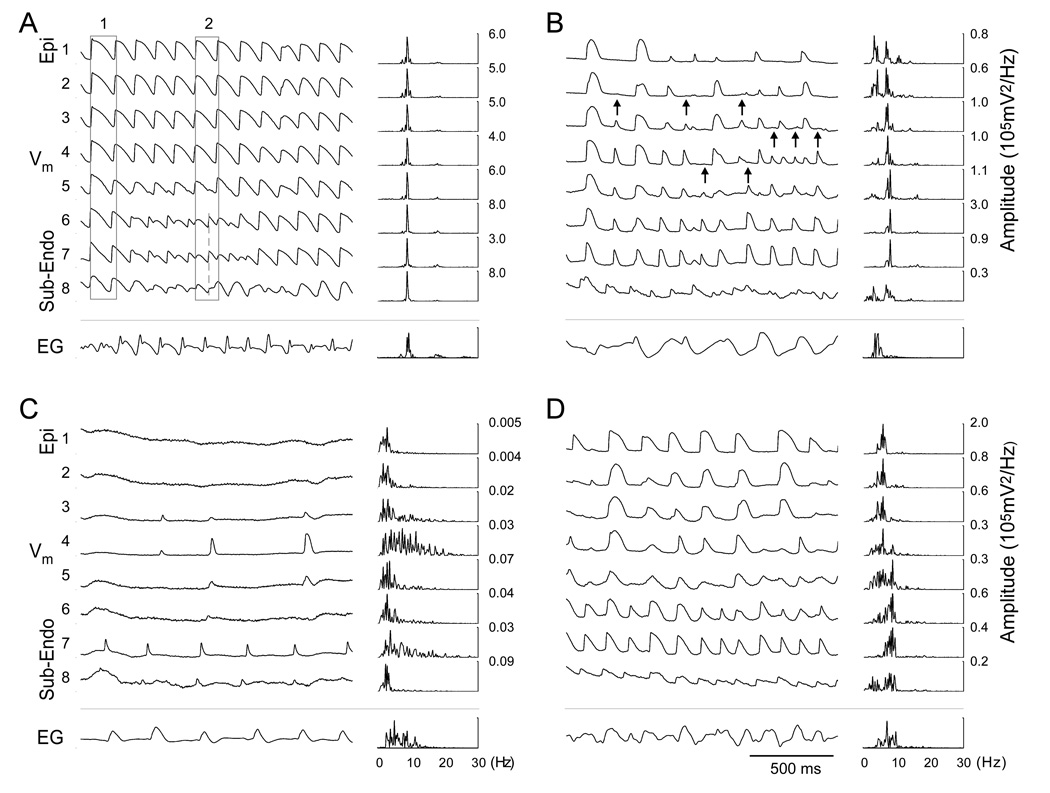
Figure 2.
Transmural Vm recordings and power spectra during different stages of VF: 10 s (A), 5 min (B), 10 min (C) and reperfusion (D). Trace numbers on the left are the same as in Figure 1 (1-Epi, 8-Sub-Endo). Arrows indicate sites of conduction block. Numbers on the right designate peak amplitudes of corresponding power spectra. EG, epicardial electrogram recorded between LV and RV.

