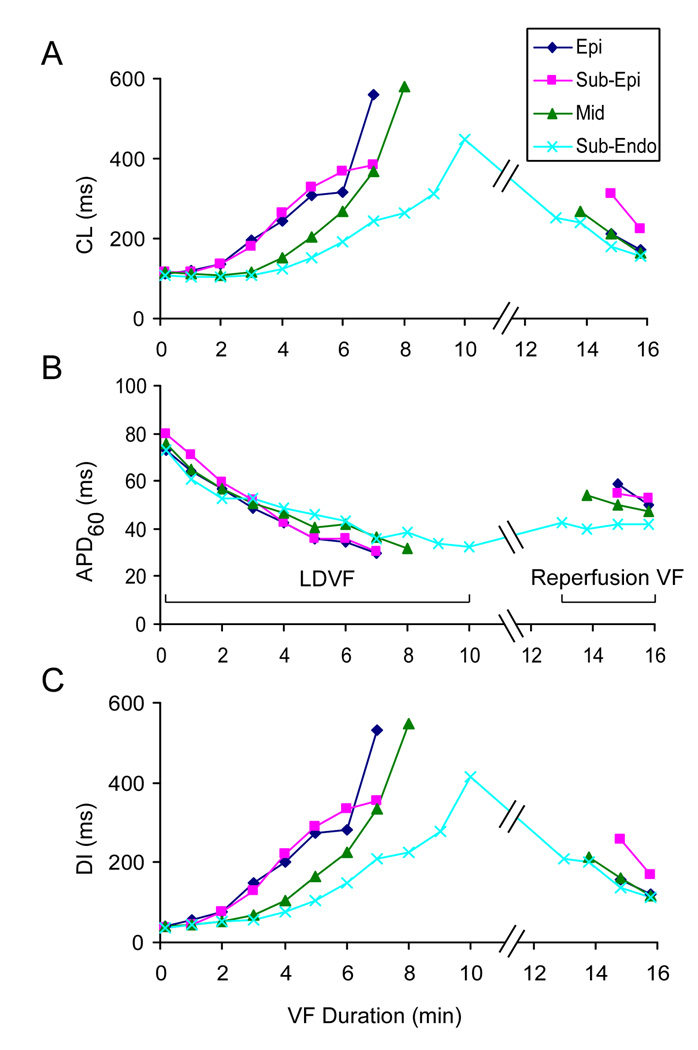
Figure 3.
Changes of intramural activation parameters CL (A), APD60 (B), and DI (C) during LDVF and VF with partial reperfusion. Blue, red, green and cyan plots represent data from Epi, Sub-Epi, Mid, and Sub-Endo layers, respectively. Mean data for all 6 hearts are shown. At the end of LDVF, data are shown only when at least 3 hearts exhibited activations at an intramural level.

