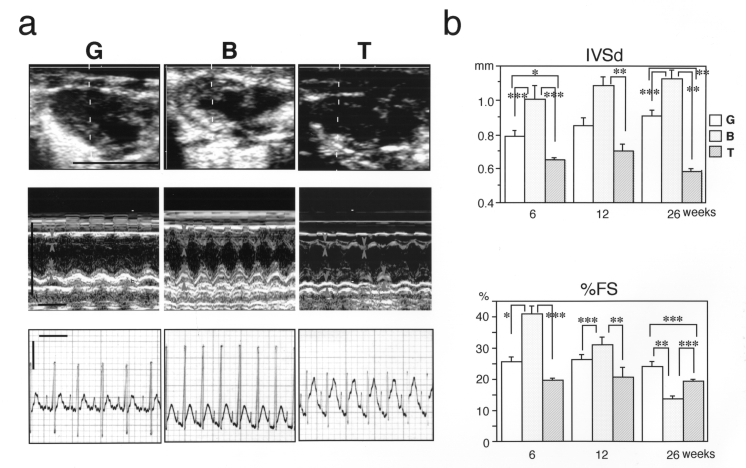
Figure 3).
Echocardiographic and electrocardiographic analyses of hamster hearts. a) Upper panel Two-dimensional view of diastolic hearts of 12-week-old hamsters. Representative figures are shown (n=6). The dotted lines indicate the scanning section by M-mode as shown in the middle panel (bar = 1 cm). Middle panel M-mode view of 12-week-old hamster hearts. Representative figures are shown (n=6). Margins of the interventricular septum (IVS) or left ventricular posterior wall (LVPW) are marked by arrows or arrowheads, respectively. Irregular movements of the IVS and LVPW in TO-2 hamsters are marked by asterisks or double asterisks, respectively (horizontal bar = 0.2 s; vertical bar = 1 cm). Lower panel Lead II of electrocardiogram. Note that no apparent arrhythmia was present in TO-2 hamsters (horizontal bar = 0.2 s, vertical bar = 0.25 V). b) Upper panel Measurement of the thickness of the interventricular septum at diastole (IVSd). Lower panel Measurement of percent of fractional shortening (%FS). Note that in the BIO14.6 animals, the IVSd became larger but %FS became smaller during development, indicating that the cardiac function of the BIO14.6 hamsters was gradually deteriorating or failing. In the TO-2 hamsters, both the IVSd and the %FS were consistently smaller than those of the BIO14.6 hamsters. The mean ± SEM was presented for all data. *P<0.05; **P<0.01; ***P<0.001

