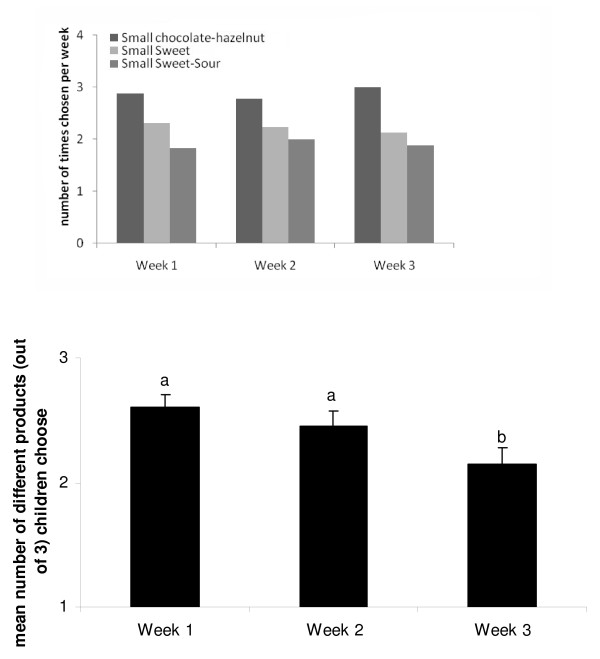
Figure 4.
Upper panel- Mean number of times (± sem) children in the CHOICE group choose either Small chocolate-hazelnut, Small Sweet or Small Sweet-Sour snacks during the first, second and third week of the intervention (min = 0, max = 7). Lower panel- Mean number of different products (± sem) (out of 3: Small, Small Sweet, Small Sweet-Sour) children in the free CHOICE group (n = 37) choose during week 1, 2 and 3.

