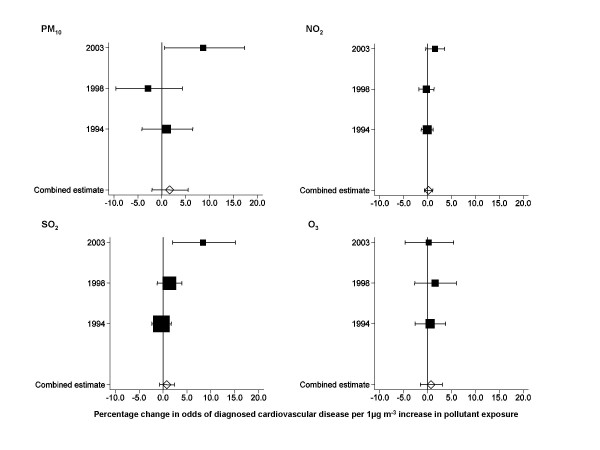
Figure 2.
Forest plots of results of multilevel logistic regression models of associations between pollutant exposure and diagnosed cardiovascular disease in women. Horizontal lines correspond to 95% CI of estimated percentage change in odds of cardiovascular disease. Combined estimates are derived from fixed effects meta-analysis of year-specific estimates using inverse variance weighting. The size of the squares reflects the inverse variance of each year and, therefore, the weighting in the combined estimate. All estimates are adjusted for age (10 year age groups), social class of head of household (6 groups), body mass index (quartiles), cigarette smoking (never, ex-, current, and region of residence (8 groups), all as categorical variables.

