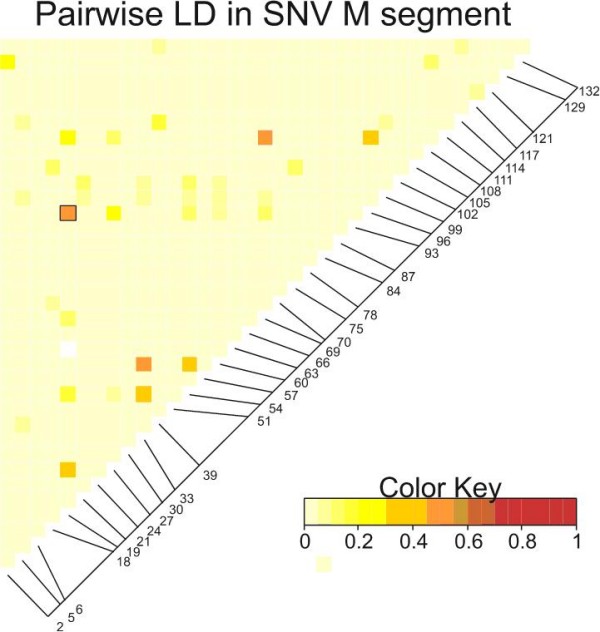
Figure 5.

A heat map of linkage disequilibrium among the 36 polymorphic sites in the M segment. Only sequences from clade 3 (Figure 3) were analyzed. The matrix is read according to the nucleotide position of segregating sites displayed along the diagonal. Small disequilibrium coefficients are represented by white or yellow and large disequilibrium coefficients are represented by orange or red.
