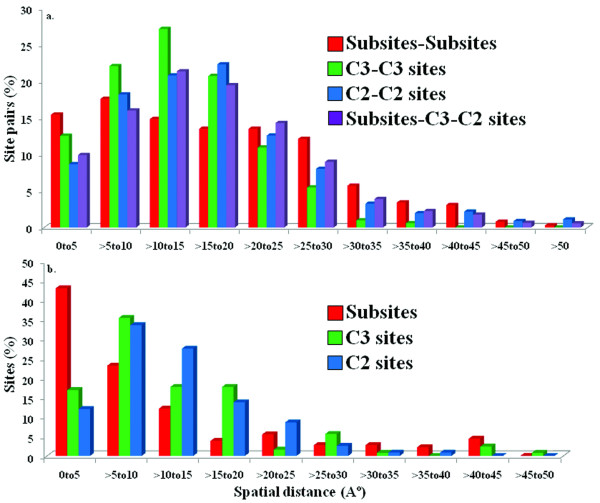
Figure 2.
Distribution of spatial distances between actual and potential subsites. (a) and distances of actual/potential subsites to the specific ligand/substrate (b) for validation test set. Distances were calculated using the nearest protein and ligand/cofactor atom coordinates supplied in the individual PDB files. Potential subsites, commonly predicted either by all three best methods are called C3 sites or by any two methods are called C2 sites.

