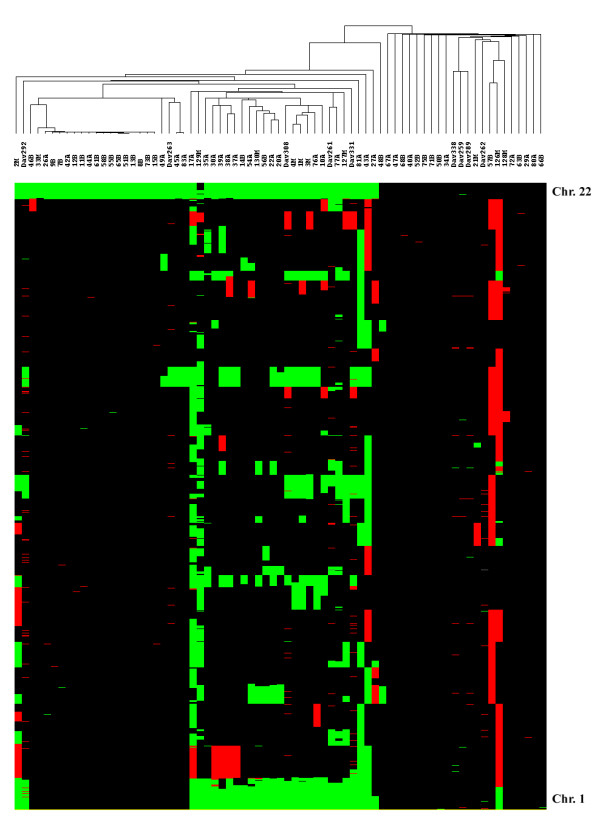
Figure 3.

Tree view of unsupervised hierarchical cluster analysis of meningiomas based upon array CGH data. A cluster diagram generated using array CGH data from Agilent cDNA array analysis of 63 sporadic solitary meningiomas, 5 sporadic multiple meningiomas and 4 familial multiple meningiomas is shown above a HEAT map showing the occurrence of imbalanced chromosome segments (ICS) (green = loss; red = gain as defined in Methods) relative to control DNA observed across the genome from chromosome 22 (top) through chromosome 1 (bottom). The dataset segregated into two branches based upon chromosome 22 deletion status, with tumors deleted for chromosome 22 on the left and tumors without chromosome 22 deletion on the right. Of the sporadic multiple meningiomas, DAV331, DAV308 and DAV292 are from the same person (but do not show identical ICS patterns) and DAV261 and DAV263 are each from different subjects; of the familial multiple meningiomas, DAV259 and DAV262 are each from different individuals in two different families while DAV289 and DAV338 are from the same subject, representing a third family.
