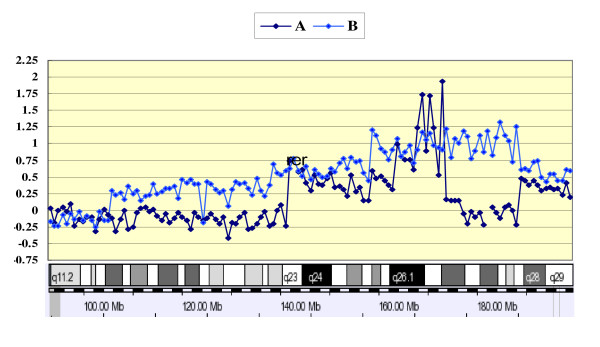
Figure 4.
Individual profiles of high copy number changes at 3q. A. High-level amplifications on 3q27 for AC from patient 12, B. 3q26.2–q28 for SCC from patient 27. In the intensity ratio profiles, the x-axis represents the map position of corresponding clone and the intensity ratios were assigned to the y-axis. The schematic presentation of cytogenetic bands as well as a map position is shown below the plot.

