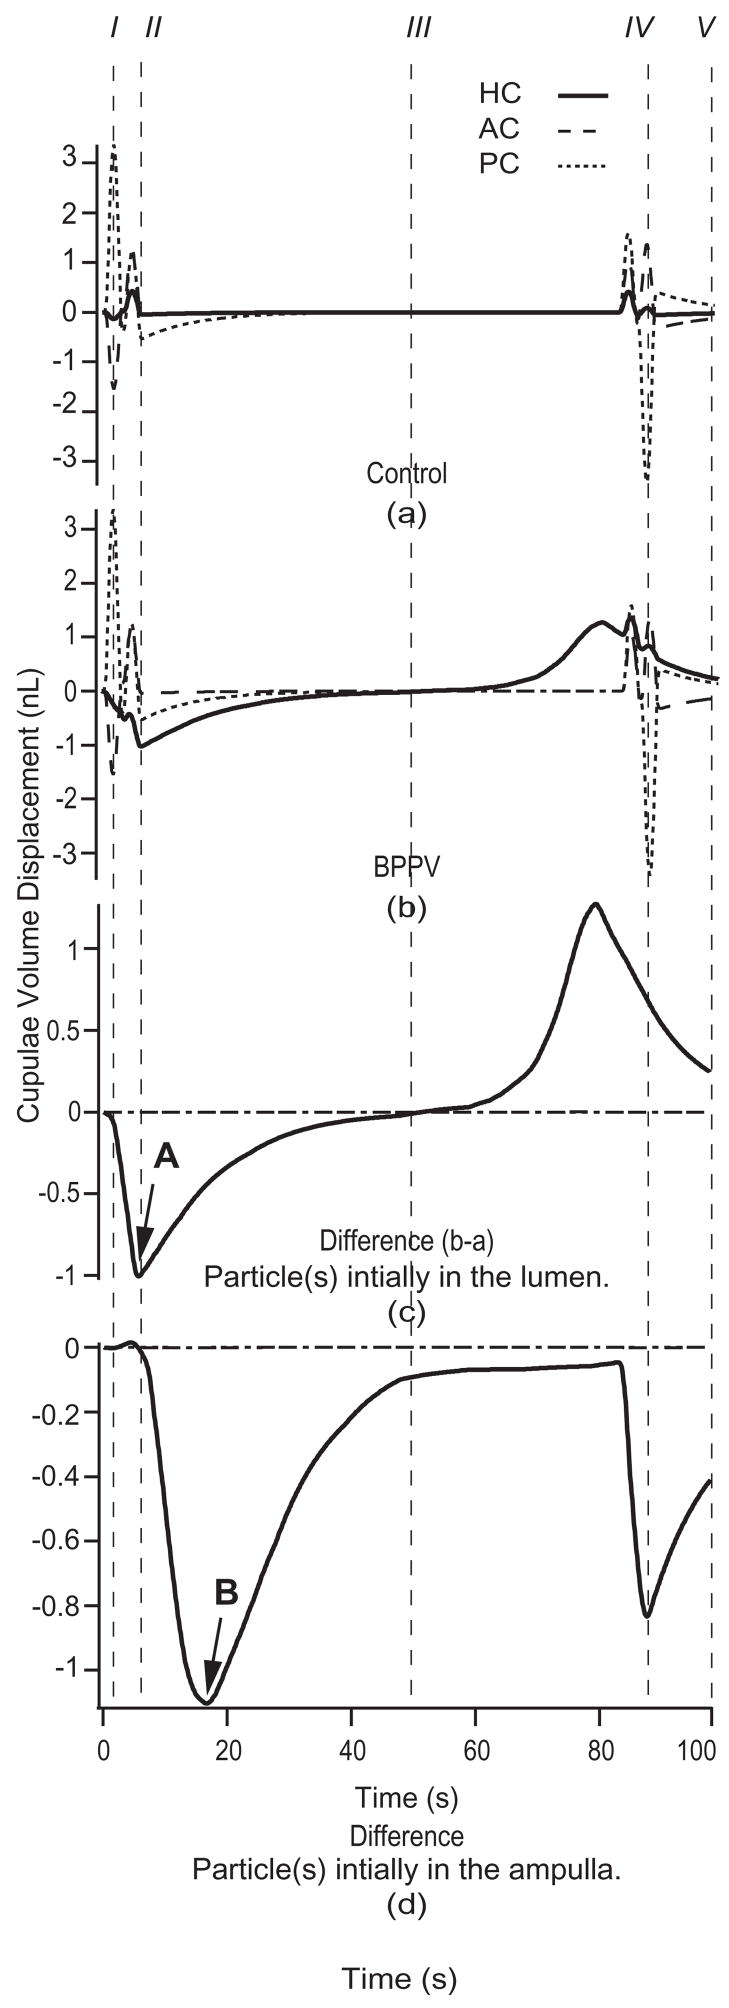
Fig. 4.
Canalithiasis responses to diagnostic maneuver. Cupulae volume displacements for the control (a) and the canalithiasis (b) conditions in response to the provocative maneuver (Fig. 2 and Table 1) when the particles were initially located in the HC lumen (response of HC – solid, PC – short dashed, AC – long dashed). I–V correspond to head positions illustrated in Fig. 2. Specific results were computed for 6 particles, each of 12 μm radius. The difference between the control and canalithiasis conditions is a measure of the pathological response. This difference is shown in the third panel (c) for the case when the particles were initially located in the HC lumen, and shown in the bottom panel (d) for the case when the particles were initially located in the HC ampulla. Note the increased latency (arrow B vs. A) when the particles are initially located in the ampulla vs. in the slender lumen of the canal.

