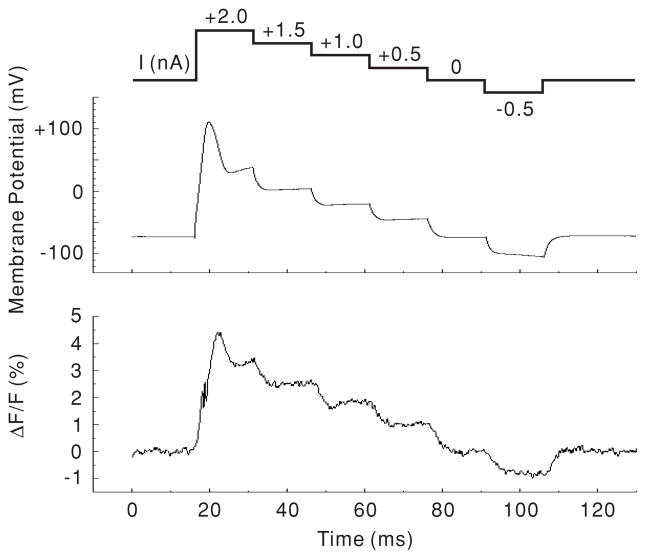
Figure 4.
DC response to step current injection. Both the membrane potential (as seen by the patch-clamp amplifier) and the photometric response (ΔF/F) were measured from the base of the OHC. The upper trace shows the stimulation protocol. Each trace is the average of four measurements. The data from this cell are fitted by ΔF/F;= 2.37 + 0.032 × MP (membrane potential) with an r value of 0.993 (p < 0.001).

