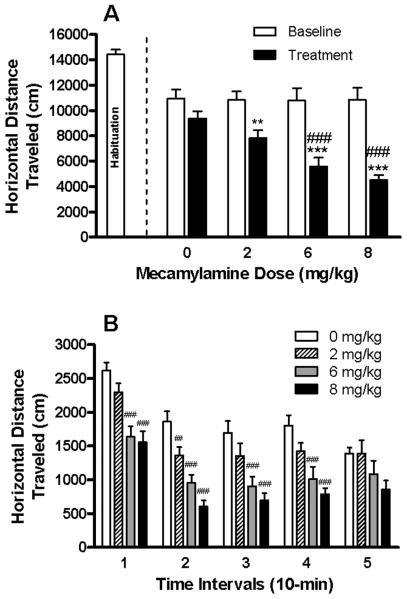
Fig. 4. Effects of MEC on locomotor activity.
Activity subsequent to MEC treatment is illustrated as both the total horizontal distance traveled throughout the 50-min session (panel A) and per 10-min interval (panel B). In panel A, values for the first activity session (habituation) are shown for reference only, and are not included in the statistical analyses. Baseline and treatment sessions represented the second and third consecutive days of activity monitoring, respectively. The mean ± SEM for n = 11-12 per treatment group is shown. **P < 0.01 and ***P < 0.001 versus within-group baseline (panel A only); ##P < 0.01 and ###P < 0.001 versus saline (i.e., 0 mg/kg) group on treatment day (panels A-B); Fisher Least Square Difference (LSD) post-hoc test.

