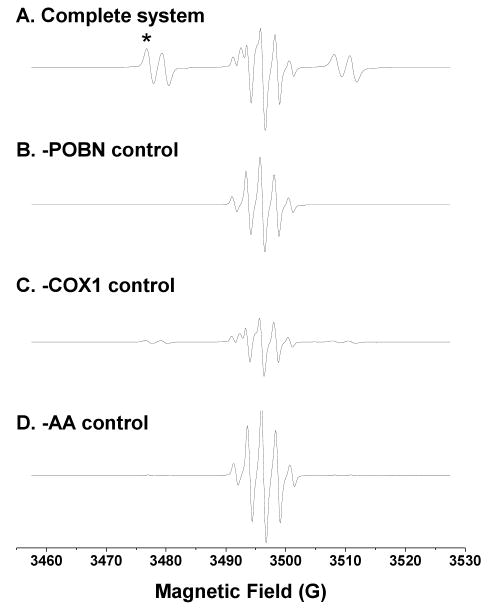
Figure 1.
Off-line ESR spectra from the complete COX-AA reaction system (incubated 30 min) and its relevant controls. (A) ESR spectrum of complete reaction system (100 mM Tris-Cl buffer, pH 8.0) containing 100 mM POBN, 50 μM hematin, 5 KUnits/mL COX1 or COX2, 5 mM hydroquinone, and 2 mM AA. A six-line ESR signal (aN ≈ 15.63 G, aH ≈ 2.53 G) overlapped a five-line signal (benzosemiquinone radicals) at the center of the spectrum; (B) ESR spectrum of the reaction excluding POBN. A five-line signal of benzosemiquinone radical was observed (aH ≈ 2.35 G); (C) ESR spectrum of the reaction excluding COX. A combination of five- and six-line ESR signals was measured at much lower intensities than that of the complete reaction system; and (D) ESR spectrum of the reaction excluding AA. A five-line benzosemiquinone radical signal dominated a very weak six-line ESR signal (aN ≈ 15.65 G, aH ≈ 2.75 G), which represents the POBN adduct of α-hydroxyethyl radical (•CH(OH)CH3) formed from ethanol oxidation (1% ethanol, v/v, present in the system because the AA-ethanol stock solution was replaced by ethanol). Note that magnetic field scans were all centered at 3494.4 G, and the low magnetic field for the first line of the six-line POBN adduct spectrum (marked as ‘*’ in Figure 1A) was fixed and used to monitor radical adducts in on-line LC/ESR measurements (Figure 2). However, the field (∼3474 G) for off-line measurements differed slightly from the on-line field in Figure 2 because different ESR cells were used.

