
Figure 7.
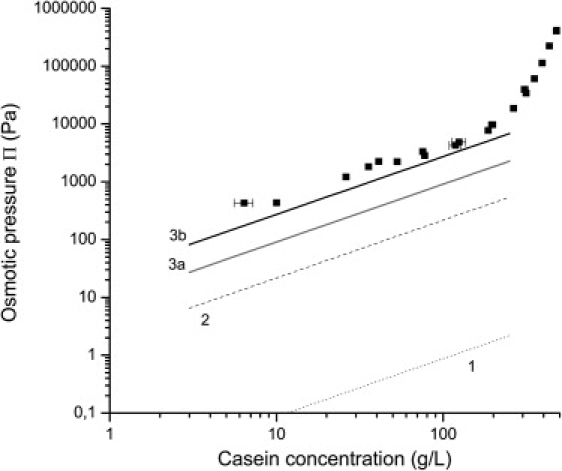
Comparison between the osmotic pressures of NPC dispersions (solid squares) and the predictions of van 't Hoff's law in the dilute regime. The osmotic pressures were calculated through Eq. 3, using the estimated number concentrations of: casein micelles (1, dotted line); serum proteins, serum caseins and proteose-peptones (2, dashed line); low molar mass residual peptides (fresh NPC dispersion: 3a, shaded line; after 7 days of dialysis at 20°C: 3b, solid line).