
Figure 2.
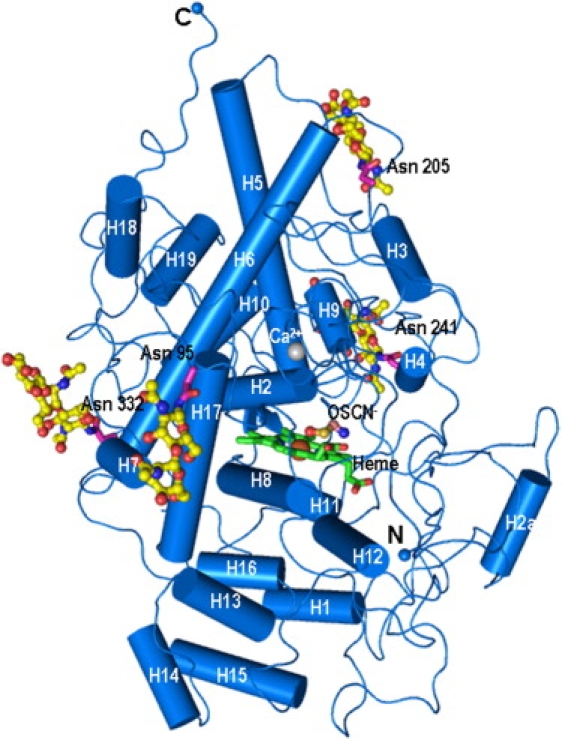
Schematic diagram of bovine lactoperoxidase complex with OSCN− ion, indicating positions of α-helices (cylinders 1–19), heme moiety (green online and medium gray in print), hypothiocyanate ion, and glycan chains (yellow online and light gray in print). Side chains of Asn-95, Asn-205, Asn-241, and Asn-332, covalently linked to glycan chains, are also shown. Figure was drawn using Pymol (39).