
Figure 1.
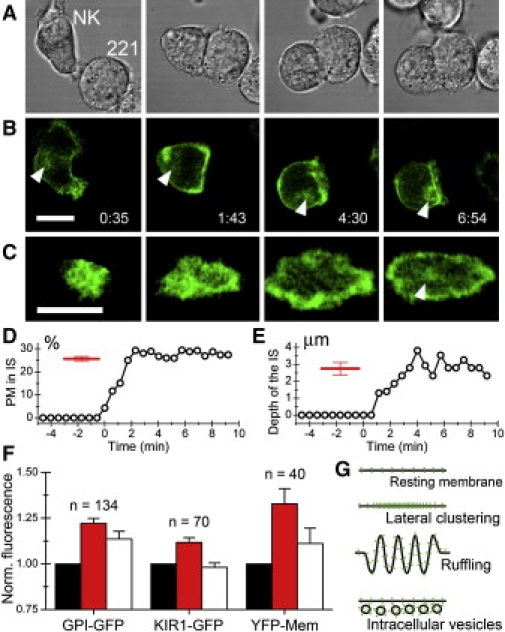
NK cell docking structure. Time-lapse imaging of a NK cell (YTS/GPI-GFP) forming a contact with a target cell (221). Bright-field (A), 3D rendered fluorescence of GPI-GFP (B) and enface view of the IS (C). White arrowhead follows the translocation of a pool of internal membranes to the intercellular contact. Scale bars = 10 μm. The fraction of the total length of the plasma membrane (PM) at the IS (D) and the depth of the IS (E) was assesed from single optical sections in the middle of the NK:target conjugate for each time-point in the time sequence shown in (A). Red bars represent average and confidence levels (95%) from snapshots of several conjugates (n=62). The fluorescence intensity of GPI-GFP, KIR2DL1-GFP and YFP-Mem was assessed in the plasma membrane outside the IS (black bars), at the periphery of the IS (red bars), and in the center of the IS (white bars) (F). Error bars represent confidence levels of 95%. Elevated fluorescence intensity could be due to lateral clustering of fluorescent molecules or accumulation of membrane in ruffles or vesicles (G).