
Figure 3.
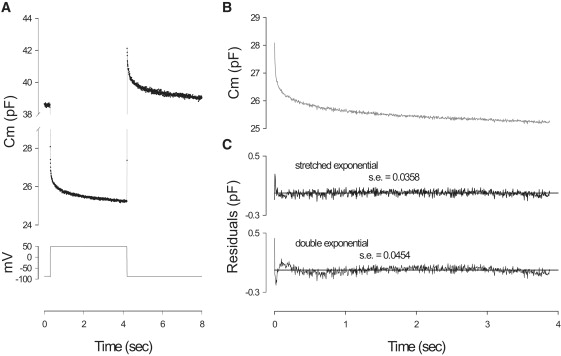
Long duration voltage pulse stimulation shows multi-exponential components in the OHC Cm relaxation. (A) Cm response induced by 4 s voltage step from −87 mV to + 53 mV. (B) Cm trace during pulse fitted with a stretched exponential. Note excellent fit with residuals (C) being greater for the double exponential fit.