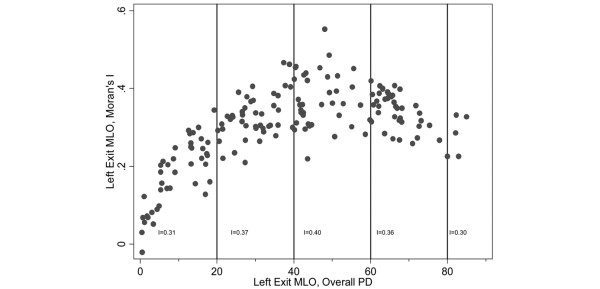
Figure 4.
Moran's I value versus overall percent density. Moran's I value for each study participant plotted against her overall percent density (PD) (both at left exit medio-lateral oblique (MLO) screen). The Moran I values quoted on the bottom of the graph were calculated on a single averaged-image representing mean regional PDs for all participants in each overall PD group.

