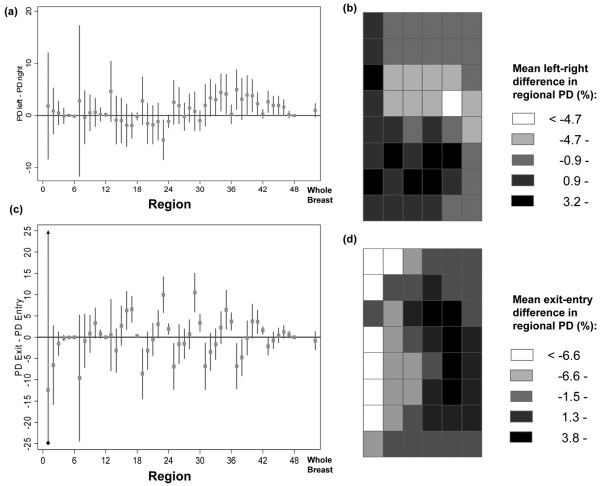
Figure 5.
Left-right and exit-entry differences in regional percent density. Within-woman mean differences (with 95% confidence intervals) in percent density (PD) between equivalent regions (a) in the left and right breasts and (c) in the exit and entry screens, for each one of the 48 regions and for the whole breast. Spatial distribution of the within-woman mean differences (b) between the left and right breasts and (d) between the exit and entry screens in the regional PD.

