
Figure 2.
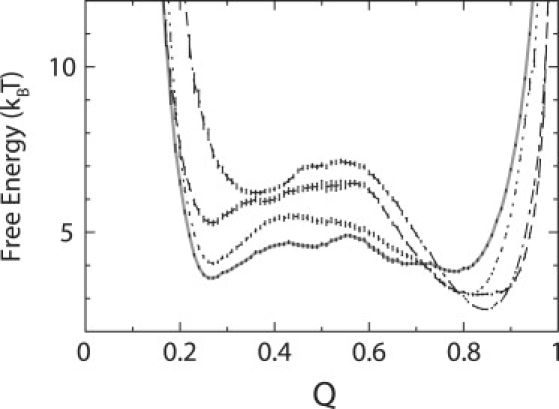
Free energy profiles are plotted as a function of Q (fraction of native contact formation) at different crowding conditions at 354 K. ϕc (bulk) = 0, solid line; ϕc (Ficoll 70) = 25%, dotted line; ϕc (Ficoll 70) = 40%, dashed line; and ϕc (dumbbell) = 40%, dot-dashed line. Error bars are included.