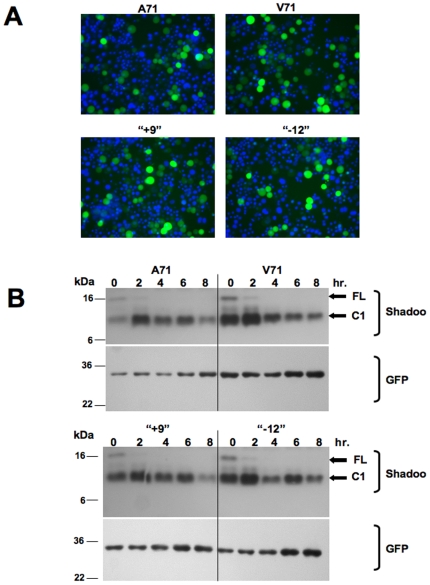
Figure 6. Expression and turnover of Sheep Sho alleles in transfected N2a cells.
(A) GFP fluorescent signals in fields of transfected cells to demonstrate similar transfection efficiencies. Individual values were V71 (10.1%), A71 (5.1%), “+9” (8.7%), “−12” (7.1%). (B) Western blot analysis of N2a transfected cells chased for different time periods in the presence of cycloheximide. Proteins samples are de-glycosylated with PNGase F. Positions of full-length and C1 fragments of sheep Sho are indicated, detected with a C-terminal anti-Sho antibody.

