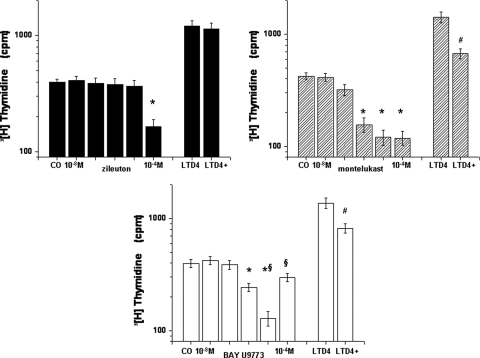
Figure 2.
Cellular proliferative responses to increasing log concentrations of zileuton (left top), montelukast (right top), and BAY u9773 (bottom) in a adenotonsillar mixed cell culture system. On the right-hand side of each graph, the proliferative response to 5 × 10⁻⁷ mmol/L (M) LTD4 and the effect of one of the three drugs, that is, zileuton (10−4 mmol/L), montelukast (10−6 mmol/L), and BAY u9773 (10−6 mmol/L), on LTD4-induced proliferation changes are also shown. * = vs control (CO); p < 0.001; # = vs LTD4; p < 0.01; § = 10−5 mmol/L vs 10−4 mmol/L BAY u9773; p < 0.01.

