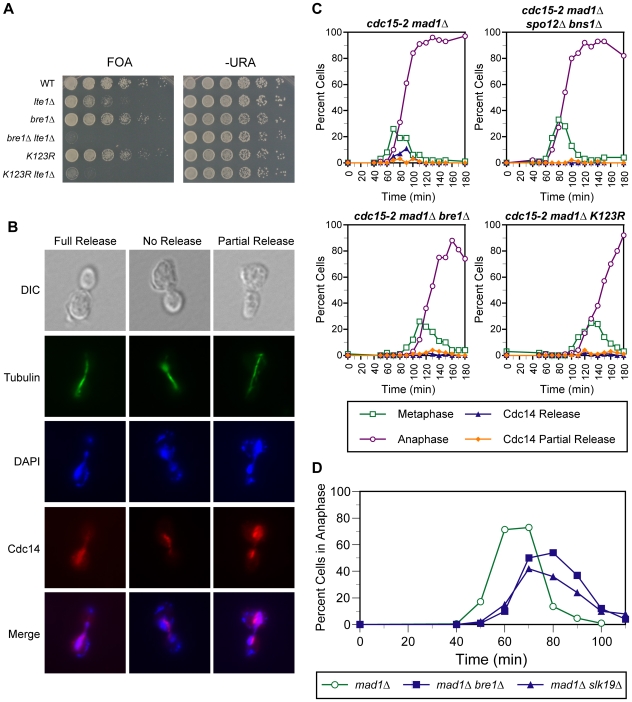
Figure 2. Mutants unable to ubiquitinate histone H2B-K123 display growth and Cdc14 release defects when combined with MEN mutants.
(A) Genetic interaction of the bre1Δ and htb1-K123R htb2-K123R mutations with the lte1Δ mutation. Shown is the growth on 5-FOA and SD –Ura minimal media of five-fold serial dilutions of strains of the indicated genotype that initially harbored an URA3-marked centromeric plasmid encoding LTE1. Plates were incubated for 3 days at 30°C. See Materials and Methods for details. (B) Representative images from Cdc14 release assay. Cells are assayed for spindle morphology and Cdc14 release phenotype by indirect immunofluorescence with anti-tubulin or anti-HA, which recognizes the HA-tagged version of Cdc14 in all strains. Cells are visualized by nuclear staining with 4′,6-diamidino-2-phenylindole (DAPI) and by differential interference contrast (DIC) optics for comparison. No release refers to dense nucleolar staining of Cdc14-HA, full release refers to cells with uniform Cdc14-HA localization throughout the nucleus, while partial release refers to cells with both nuclear and residual nucleolar staining. (C) Time course analysis. The temporal profile of Cdc14 release from nucleolar sequestration is displayed for cdc15-2 mad1Δ mutants harboring either no additional mutation, bre1Δ, htb1-K123R htb2-K123R, or spo12Δ bns1Δ mutations. Alpha-factor arrested cells are released into YPD media at 37°C to inactivate the cdc15-2 mutant gene product and timepoints are processed for indirect immunofluorescence as described in Figure 2B. Approximately 200 cells were scored for each timepoint for metaphase or anaphase spindles and for full or partial release of Cdc14-HA. (D) Time course analysis. Cell cycle progression of mad1Δ, mad1Δ bre1Δ, and mad1Δ slk19Δ mutants arrested and released from alpha-factor arrest was measured by scoring ∼200 cells from each timepoint for anaphase spindles by indirect immunofluorescence.

