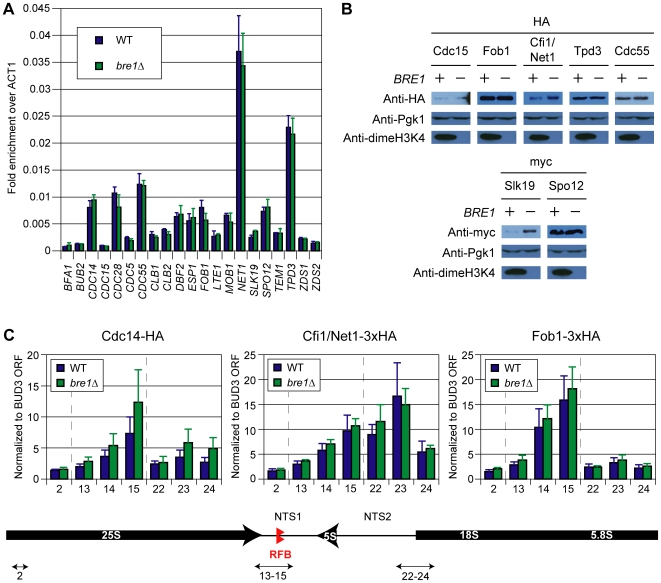
Figure 3. Changes in expression and chromatin association of mitotic exit regulators do not explain Cdc14 release defects in bre1Δ mutants.
(A) Reverse transcription coupled to quantitative PCR analysis (RT–QPCR) of known mitotic exit regulators. Levels of cDNA generated from RT reactions of wildtype and bre1Δ total RNA were measured by QPCR. The mean values and standard deviations presented represent triplicate samples for each strain and are normalized to ACT1 levels. Reactions were performed without RT (−RT) to establish background DNA contamination. BFA1, the lowest level transcript, was enriched 15 fold over the −RT control (data not shown). (B) Western blots of epitope-tagged regulators of Cdc14 release. Cdc15, Fob1, Cfi1/Net1, Tpd3 and Cdc55 were tagged with 3xHA while Slk19 and Spo12 were tagged with 4xmyc and 13xmyc, respectively. The blots were cut into two parts to simultaneously probe for the epitope tag on the upper part and with anti-dimeH3K4 on the lower to demonstrate loss of BRE1. The upper blots were stripped and reprobed with anti-Pgk1 to control for loading. (C) Chromatin immunoprecipitation of HA tagged Cdc14, 3xHA tagged Cfi1/Net1, and 3xHA tagged Fob1 in wild type and bre1Δ mutant backgrounds. The numbers on the x-axis refer to primer pairs used to amplify the immunoprecipitated samples corresponding to locations at the rDNA locus as depicted in the schematic below and from [62]. Quantitative PCR mean values and standard deviations presented represent triplicate samples for each rDNA primer set and are normalized to values from a control primer set located within the open reading frame (ORF) of BUD3. Dotted lines separate the primer pairs corresponding to different regions of the rDNA locus. Bottom panel: NTS 1 and 2 = non-transcribed spacer regions 1 and 2. RFB = replication fork block. 5S, 5.8S, 18S, 25S = rDNA open reading frames.

