
Figure 5.
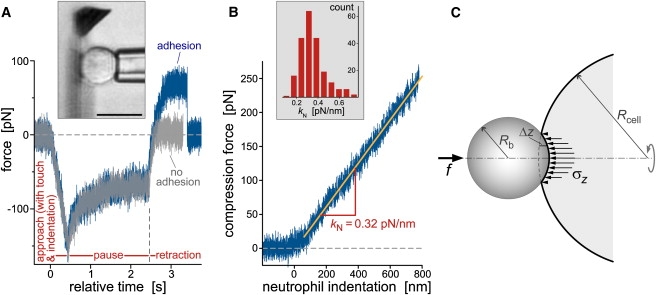
(A) Test cycles of neutrophil-compression experiments (illustrated by the videomicrograph in the inset; bar = 10 μm) were automated via remote pipette translation in three stages: approach, pause, and retraction. Contact between the pipette-held cell and the cantilever was detected in real time, and the maximum cell-indentation force was controlled by feedback. The plot includes two force-time curves that were overlaid on top of each other, demonstrating the repeatability of cell indentation (during approach) and relaxation (during pause). During cell retraction, the force usually remained flat after reaching zero, signifying the absence of adhesion (light curve). However, we also observed nonspecific adhesion between the cell and the cantilever (dark curve), occasionally leading to the extrusion of membrane tethers (Fig. 7). (B) The cell-compression segments of the force-time traces were converted to force-indentation graphs (defining the compression force as positive). The exposed, roughly linear force-indentation behavior was analyzed in terms of a “neutrophil spring constant,” kN. The included histogram revealed a most frequently observed kN-value of ∼0.32 pN/nm at a neutrophil-translation speed of 1 μm/s. (C) Sketch defining the notation used for the Derjaguin approximation that allows us to compare indentation experiments conducted with differently shaped probe tips.