
Figure 9.
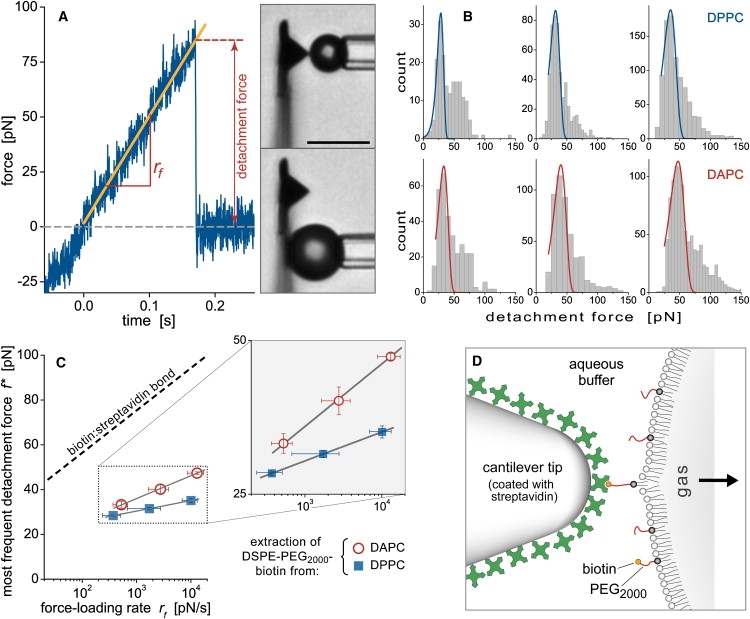
Analysis of the lipid-extraction measurements. (A) Positive forces recorded during force-ramp tests marked attachments between the microbubble and the cantilever. The detachment forces and slopes (rf) of ∼3400 such attachments were measured. The videomicrographs (bar = 10 μm) illustrate tests using different bubble sizes and cantilever-contact locations. (B) Histograms of detachment forces for two different bubble-surface compositions, DPPC (top) and DAPC (bottom). Each row of histograms was obtained using three different nominal force-loading rates. The histogram peaks at low forces were locally matched with the Evans distribution. (C) The peak forces (error bars denote the standard error in peak location) are plotted as a function of log(rf), where rf is the most frequently measured loading rate (horizontal error bars give the standard deviation of the individual rf-measurements). Included is the dynamic force spectrum of the biotin:streptavidin bond (8) (dashed line). The force spectra for lipid extraction are enlarged in the inset. (D) Illustration of the serial linkage comprising the bond between streptavidin and a biotin lipid as well as the latter's hydrophobic anchor in the lipid monolayer at the bubble surface. Our measurements suggest that the lipid anchor is significantly weaker than the biotin:streptavidin bond and will usually fail first when stressed.