
Figure 3.
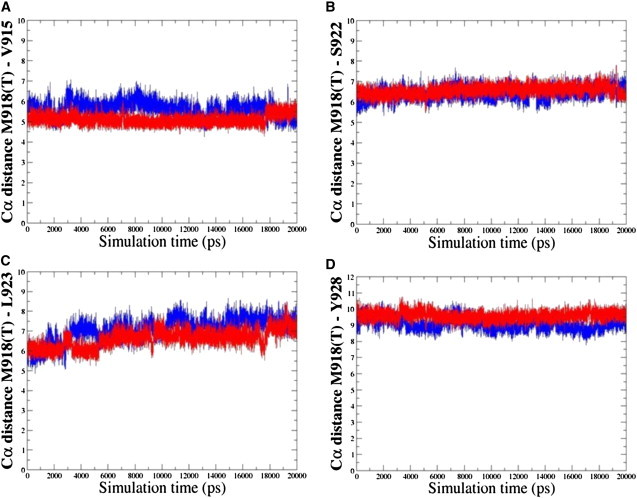
Analysis of MD simulations with the inactive RET kinase. Time evolution history of the distances between Ca atoms of the residues in the local structural environment of the mutational site. Time evolution of the distances between Ca atoms of the M918T RET and V915 RET (A), M918T RET and S922 RET (B), M918T RET and L923 RET (C), and M918T RET and Y928 RET (D). Time evolution of the distances for the M918 WT RET is shown in blue; time evolution of the distances for the T918 RET mutant is shown in red.