
Figure 6.
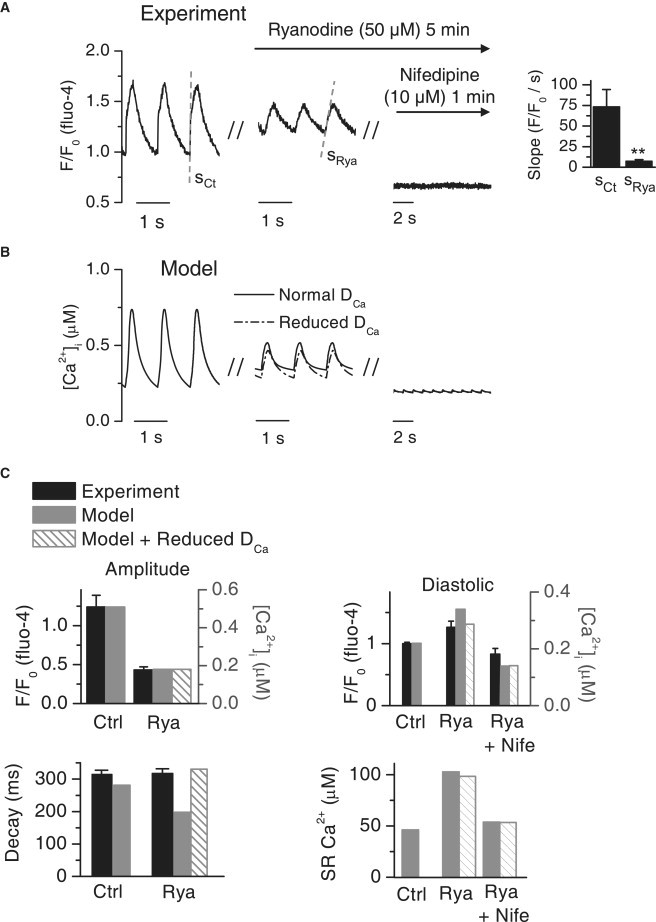
The experimental and simulated effects of ryanodine and nifedipine on the cytosolic Ca2+ signals. (A) Average cytosolic Ca2+ was recorded from a single cardiomyocyte during 1-Hz pacing using the line-scan method (left). The middle panel shows the Ca2+ signal from the same cell after 5 min perfusion of ryanodine (50 μM). After this, the ryanodine perfusion was continued with nifedipine (10 μM), and after 1 min of perfusion, the Ca2+ signal was recorded from the same cell (right). The average value of the initial slope of the Ca2+ transient (dashed gray line) in control conditions and after exposure to ryanodine (right, n = 14, ∗∗p < 0.01). (B) The experiment was reproduced by simulation with the model (see Methods). The effects of ryanodine and ryanodine + nifedipine were simulated with the DCa fitted to our data (normal, solid line) and with the DCa in water (reduced, dash-dotted line). The figure shows the average cytosolic Ca2+ from the simulations. (C) The simulated data with normal DCa (solid gray bars) and with reduced DCa (gray-hatched bars) and the average experimental data (black bars) from the experiments (n = 14). The left panels show the Ca2+-transient amplitude and decay in control conditions and after exposure to ryanodine. The upper right panel shows the diastolic [Ca2+]i in control, with ryanodine, and with ryanodine + nifedipine. The lower right panel shows the simulated diastolic SR Ca2+ content in cytosol volume in control, ryanodine, and ryanodine + nifedipine conditions.