
Figure 10.
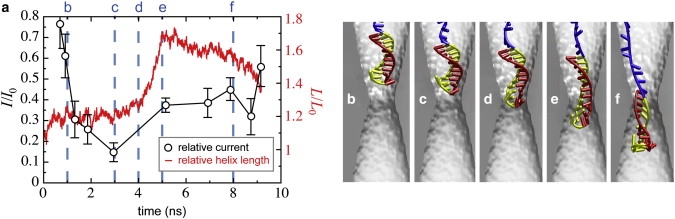
Stretching of the double helix and ionic current. (a) Ionic current (black, left abscissa) derived from the MD simulation illustrated by the snapshots in panels b–f and the strain of the helix (red, right abscissa) shown at the corresponding times. The elongation of the helix, which reaches a maximum value at ∼5 ns, reduces its cross section, causing an increase in the current through the pore.