
Figure 12.
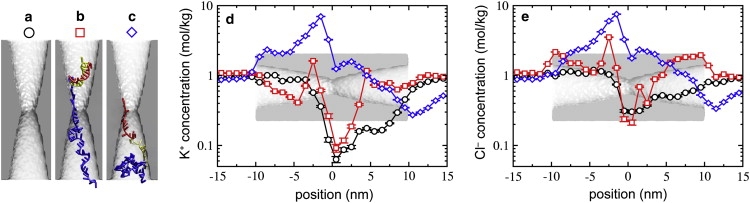
Effect of hpDNA on the ion concentration within the pore. (a) Open pore. (b) Nanopore/hpDNA conformation for reduced current. (c) Nanopore/hpDNA conformation for enhanced current. (d and e) Concentration profile of K+ (d) and Cl− (e) along the pore axis for the systems illustrated in panels a–c.