
Figure 2.
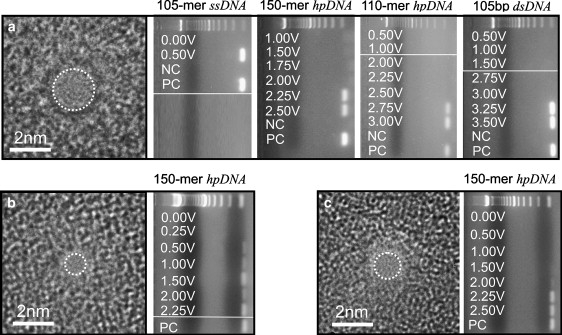
Experimental determination of threshold voltage. (a) (Left) A transmission electron micrograph of a 1.9-nm × 2.0-nm pore in a nominally 10-nm-thick nitride membrane. The shot noise in the center of the images is associated with the pore. (Right) Gel arrays indicating the voltage at which 105-mer ssDNA, 150-mer hpDNA (12-basepair double helix with a 76-basepair loop), 110-mer hpDNA (10-basepair double helix with a six-basepair loop), and 105-basepair dsDNA permeate the pore. NC and PC indicate the negative and positive control samples taken from the same solutions used in the anode and cathode chambers. For reference, a 100-basepair ladder is shown in the top lane of each gel. We find that ssDNA permeates the pore for voltages ϕ > 0.5 V, while 105-basepair dsDNA permeates the pore only for voltages ϕ > 3.0 V. The hairpins permeate at voltages intermediate to these: 150-mer hpDNA permeates the same pore for ϕ > 2.0 V and 110-mer hpDNA for ϕ > 2.5 V. (b and c) High resolution transmission electron micrographs of 0.8-nm × 1.0-nm, and 1.2-nm × 1.4-nm pores through Si3N4 membranes nominally 10-nm-thick, respectively. The gel arrays next to each micrograph contain horizontal lanes with bands indicating the voltage, ϕ, at which 150-mer hpDNA permeates the pore. For reference, a 100-basepair ladder is shown in the top lane of each gel. The negative control is represented by the 0-V lanes. The 150-mer hpDNA permeates the 1-nm pore at low voltage ϕ > 0.25 V, but only permeates the 1.4-nm pore for ϕ > 1.5 V. Thus, the threshold depends on the pore diameter.