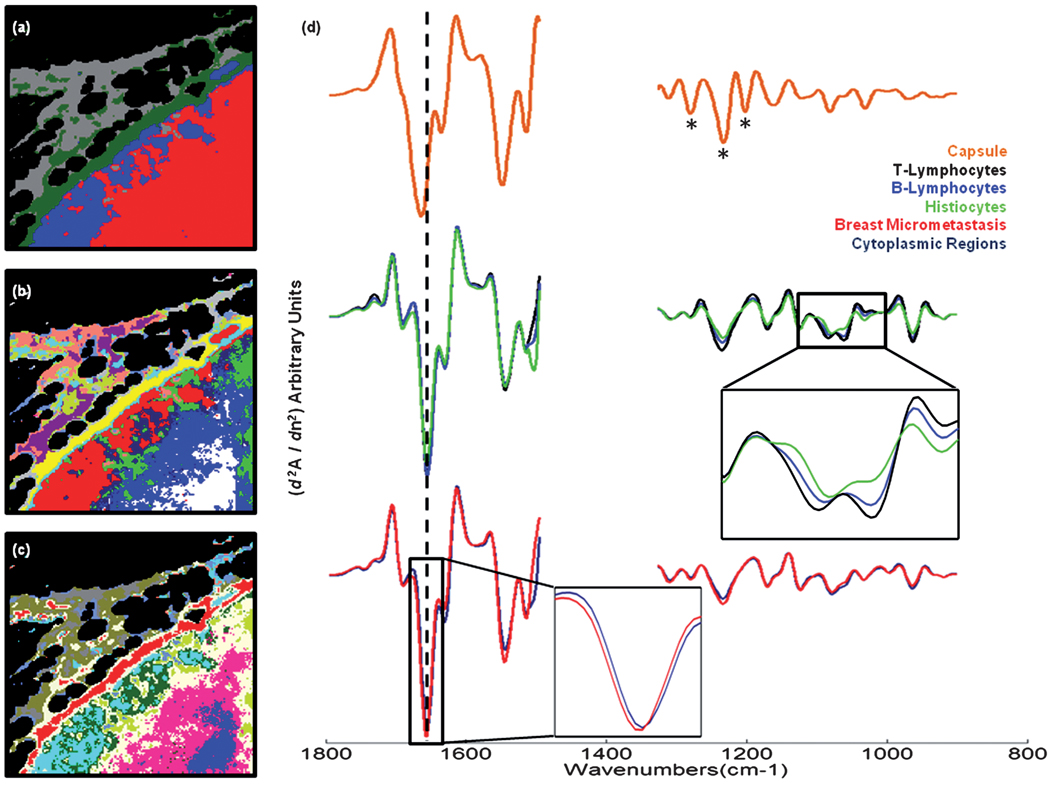
Fig. 5.
Panel (a): 4-cluster spectral image, constructed via HCA in the 1800–1496 cm−1 and 1350–900 cm−1 spectral ranges, of the unstained and paraffinised tissue area shown in Fig. 3(a). Panel (b): 13-cluster spectral image obtained from the same HCA described in panel (a). Panel (c): 13-cluster spectral image, constructed via HCA in the 1350–900 cm−1 spectral range. Panel (d): mean 2nd derivative spectra calculated for the yellow (capsule), white (T-lymphocyte), royal blue (B-lymphocyte), green (histiocyte), dark blue (breast micro-metastasis, cytoplasmic region) and red (breast micro-metastasis, highly nucleated region) regions of panel (b).

