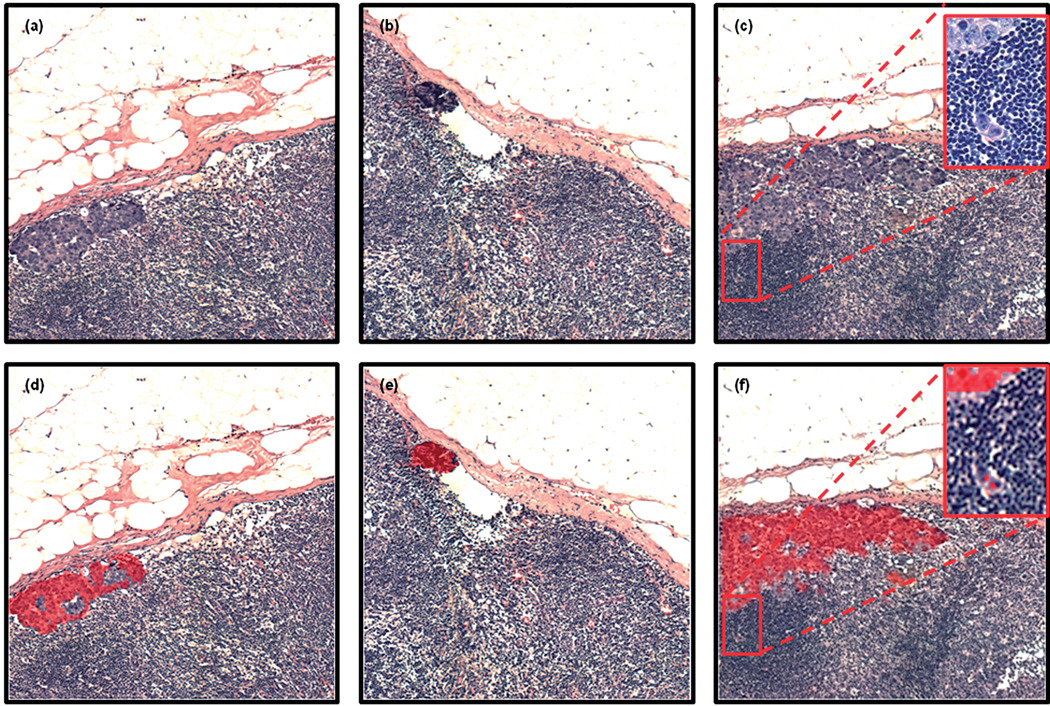
Fig. 7.
Panels (a)–(c): H&E stained images captured from 3 tissue regions (1 mm × 1 mm areas) scrutinised by infrared micro-spectral imaging. Panels (d)–(f): semi-transparent (red colour) overlays of areas identified by HCA to contain abnormal tissue. These overlays co-localise extremely well with changes in cell morphology detectable by microscopic inspection. Note the isolated tumour cells identified in panel (c) and detected by HCA in panel (f).

